

Quarterly Market Review: January - March 2023
The Markets (first quarter through March 31, 2023)
Wall Street proved resilient during the first quarter of the year, despite rising inflation, uncertainty about the Federal Reserve's actions, interest-rate hikes, and banking concerns. Inflationary data in January seemed to show inflation may have peaked, and the Fed would scale back its interest-rate hikes, if not cut them. However, subsequent inflation data showed prices ramped up again. Stocks and bond prices dipped as investors responded to concerns that interest rates would continue to rise and for a longer period of time. In addition to the impact of rising inflation, two major banks collapsed in March, sending bank stocks lower. Credit Suisse Group, nearing failure, was taken over by rival UBS Group, while several U.S. banks provided funds to keep First Republic Bank afloat. The economic recession that has been predicted has yet to come to fruition. The labor market remained strong, and while inflation continued to rise, the two primary indicators, the Consumer Price Index and the Personal Consumption Expenditures Price Index, showed prices slowed on an annual basis.
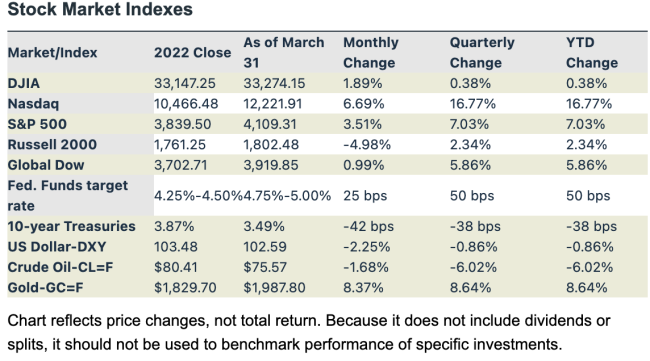
Despite all of this apparent turmoil, coupled with the ongoing war in Ukraine, stocks regained their footing and ended the quarter on the plus side. The tech-heavy Nasdaq led the benchmark indexes, followed by the S&P 500, the Global Dow, the Russell 2000, and the Dow. Investors poured money back into Mega cap Tech shares, driving them higher during the first quarter of 2023 after an underperforming 2022. Those gains helped drive the Nasdaq and the S&P 500 higher. Even with investors taking some gains from the Mega caps, other market sectors reaped the benefits. Energy stocks, which excelled in 2022, fell in the first quarter of 2023, as did crude oil prices. Gas prices rose minimally higher, with regular retail prices averaging $3.421 per gallon on March 27, $0.14 over prices on January 4. The dollar dipped lower, while gold prices rose higher.
The quarter kicked off with stocks enjoying their best January performance since 2019, as inflation data suggested that inflation may have peaked, raising hopes that the Federal Reserve would scale back interest-rate hikes and temper fears of an economic recession. Nevertheless, Federal Reserve Chair Jerome Powell cautioned that the battle against rising inflation was far from over and additional rate hikes were upcoming. In fact, the Federal Reserve hiked interest rates 25.0 basis points on the last day of the month. Growth stocks performed best, with Mega caps making solid gains. Consumer discretionary, communication, and tech sectors performed well, while defensive sectors, such as utilities, health care, and consumer staples, dipped lower. Bond prices advanced, pulling yields lower. While 260,000 new jobs were added in December, the growth was the slowest in two years. Average hourly earnings rose to the lowest annual level (4.6%) since September 2021. However, manufacturing declined at the fastest rate since May 2020, while services retracted for the third month running, according to the S&P Global Manufacturing PMI™. Nevertheless, each of the benchmark indexes listed here added value, led by the Nasdaq (10.7%), followed by the Russell 2000 (9.7%), the Global Dow (7.8%), the S&P 500 (6.2%), and the Dow (2.8%). Ten-year Treasury yields fell 35.0 basis points, crude oil prices dipped 1.7%, the dollar slid 1.4%, but gold prices advanced 6.3%.
Stocks gave up some of their January gains in February, with each of the benchmark indexes losing value. The Dow (-4.2%) fell the furthest, followed by the Global Dow (-2.7%), the S&P 500 (-2.6%), the Russell 2000 (1.8%), and the Nasdaq (-1.1%). Bond prices declined, driving yields higher, with 10-year Treasury yields advancing 39 basis points. Crude oil prices decreased 2.8% to $76.86 per barrel. The dollar rose 2.8% against a basket of currencies. Gold prices lost most of their January gains, falling 5.7% in February. Consumer prices advanced, with core prices (excluding food and energy prices) climbing 0.6%, the biggest advance since August. Over 500,000 new jobs were added, nearly three times the consensus estimates, and the largest increase in six months. The unemployment rate slid to 3.4%, its lowest level since 1969. Consumer spending rose 1.8%, the most in nearly two years.
March was a very choppy month for market returns. Despite an apparent banking crisis, investors stayed the course for the most part, driving stocks mostly higher. The Nasdaq and the S&P 500 led the gainers of the benchmark indexes listed here. Several sectors outperformed, including information technology, communication services, and utilities, while financials fell notably on the heels of the aforementioned bank failures. Manufacturing retracted, while services advanced, according to purchasing managers surveyed. Labor remained strong, with 311,000 new jobs added. Hourly earnings rose by $0.08 for the month and 4.6% since February 2022. The Consumer Price Index rose 0.4% after falling 0.5% the previous month. The PCE price index increased 0.3% and 5.0% over the past 12 months. The economy advanced at an annualized rate of 2.6% in the fourth quarter, short of the 3.2% increase in the third quarter. Crude oil prices and the dollar declined, while gold prices climbed higher.
Latest Economic Reports
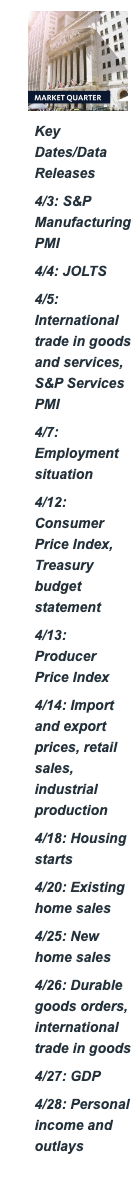
- Employment: Job growth remained strong in February with the addition of 311,000 new jobs, compared with an average monthly gain of 343,000 over the prior six months. Despite federal interest-rate hikes aimed at slowing the economy and inflation, there is little evidence that the supply of labor is peaking. In February, notable job gains occurred in retail trade, government, leisure and hospitality, and health care. Employment declined in information and in transportation and warehousing. The unemployment rate edged up 0.2 percentage point to 3.6%. in February, the number of unemployed persons rose by 242,000 to 5.9 million. The employment-population ratio, at 60.2%, was unchanged in February, while the labor force participation rate, at 62.5%, edged up 0.1 percentage point from the previous month. Both measures have shown little net change since early 2022. In February, average hourly earnings increased by $0.08 to $33.09. Over the past 12 months ended in February, average hourly earnings rose by 4.6%. The average workweek decreased by 0.1 hour to 34.5 hours in February.
- There were 191,000 initial claims for unemployment insurance for the week ended March 25, 2023. The total number of workers receiving unemployment insurance was 1,689,000. By comparison, over the same period last year, there were 171,000 initial claims for unemployment insurance, and the total number of claims paid was 1,506,000.
- FOMC/interest rates: The Federal Open Market Committee met March 21-22, at which time the Committee increased the Federal Funds target rate range by 25 basis points to 4.75%-5.00%. The statement from the FOMC indicated that it is "strongly committed to returning inflation to its 2.0% objective." The Committee also noted that it would consider adjusting its policy stance based on "labor market conditions, inflation pressures and inflation expectations, and financial and international developments."
- GDP/budget:Despite rising interest rates and accelerating inflation, the U.S. economy advanced in the fourth quarter of 2022. The economy, as measured by gross domestic product, accelerated at an annual rate of 2.6% in the fourth quarter of 2022, according to the third and final estimate from the Bureau of Economic Analysis. GDP increased 3.2% in the third quarter after falling in the first and second quarters, 1.6% and 0.6%, respectively. The deceleration in fourth-quarter GDP compared to the previous quarter primarily reflected a downturn in exports and decelerations in consumer spending, nonresidential fixed investment, and state and local government spending. These movements were partly offset by an upturn in private inventory investment, a smaller decrease in residential fixed investment, and an acceleration in federal government spending. Imports, which are a negative in the calculation of GDP, decreased less in the fourth quarter than in the third quarter. Consumer spending, which accounted for about 70.0% of GDP, rose 1.0% in the fourth quarter compared to an increase of 2.3% in the third quarter. Consumer prices increased 3.7% in the fourth quarter (4.3% in the third quarter). Excluding food and energy, consumer prices advanced 4.4% in the fourth quarter (4.7% in the third quarter). In 2022, consumer prices increased 6.3%, compared with an increase of 4.0% in 2021. Overall, In GDP increased 2.1% in 2022, compared with an increase of 5.9% in 2021.
- February saw the federal budget deficit come in at $262.4 billion, $223.6 billion over the January deficit and $45.8 billion above the February 2022 deficit. The deficit for the first five months of fiscal year 2023, at $722.6 billion, is $247.0 billion more than the first five months of the previous fiscal year. In February, government receipts totaled $262.1 billion and $1,735.0 trillion for the current fiscal year. Government outlays were $524.5 billion in February and $2,457.6 trillion through the first five months of fiscal year 2023. By comparison, receipts in February 2022 were $289.9 billion and $1,806.8 trillion through the first five months of the previous fiscal year. Expenditures were $506.4 billion in February 2022 and $2,282.4 trillion through the comparable period in FY22.
- Inflation/consumer spending: Inflationary pressures continued to mount in February. According to the latest Personal Income and Outlays report, the Personal Consumption Expenditures Price Index increased 0.3% in February and 5.0% since February 2022. Prices excluding food and energy also advanced 0.3%, following increases of 0.5% in January and 0.4% in December. Prices for goods rose 0.2%, while prices for services increased 0.3% in February, with prices for food rising 0.2%, although prices for energy fell 0.4%. Since February 2022, consumer prices for food increased 9.7% and energy prices rose 5.1%. Personal income rose 0.3% in February, while disposable personal income increased 0.5%. Consumer spending rose 0.2% in February after climbing 2.0% the previous month.
-
The Consumer Price Index rose 0.4% in February after increasing 0.5% in January. Over the 12 months ended in February, the CPI advanced 6.0%, down from 6.4% for the year ended in January. Excluding food and energy prices, the CPI rose 0.5% in February and 5.5% over the last 12 months. Prices for shelter, up 0.8%, were by far the largest contributor to the February CPI increase, accounting for nearly 70.0% of the overall advance. In February, food prices rose 0.4%, while energy prices decreased 0.6%. For the 12 months ended in February, energy prices increased 5.2%, food prices rose 9.5%, and prices for shelter advanced 8.1%.
-
Prices that producers receive for goods and services fell 0.1% in February after advancing 0.3% (revised) in January. Producer prices increased 4.6% for the 12 months ended in February after rising 5.7% (revised) for the 12 months ended in January. In February, the PPI index saw prices for both goods (-0.2%) and services (-0.1%) decrease. Producer prices less foods, energy, and trade services rose 0.2% in February after increasing 0.5% in the previous month. Prices less foods, energy, and trade services advanced 4.4% for the year ended in February, unchanged from the 12 months ended in January.
- Housing: Sales of existing homes increased for the first time in thirteen months after vaulting 14.5% in February. Despite the increase, existing-home sales dropped 22.6% from February 2022. According to the report from the National Association of Realtors®, home buyers took advantage of any interest rate declines, while some areas of the country saw gains where home prices declined. The median existing-home price was $363,000 in February, higher than the January price of $361,200 but slightly lower than the February 2022 price of $363,700. Unsold inventory of existing homes represents a 2.6-month supply at the current sales pace, marginally lower than the January supply of 2.9 months. Sales of existing single-family homes rose 15.3% in February but were down 21.4% from February 2022. The median existing single-family home price was $367,500 in February, up from $365,400 in January but lower than the February 2022 price of $370,000.
- New single-family home sales advanced in February, climbing 1.1% and marking the fourth consecutive monthly increase. However, sales are down 19.0% from February 2022. The median sales price of new single-family houses sold in February was $438,200 ($426,500 in January). The February average sales price was $498,700 ($479,800 in January). The inventory of new single-family homes for sale in February represented a supply of 8.2 months at the current sales pace, down marginally from the January estimate of 8.3 months.
- Manufacturing: Industrial production was unchanged in February, following a 0.3% increase in January and a 1.4% drop in December. Manufacturing increased 0.1% in February (1.3% in January) but was 1.0% below its year-earlier level. Mining decreased 0.6%. Utilities, on the other hand, rose 0.5% over the 12 months ended in February, total industrial production was 0.2% below its year-earlier level.
- February saw new orders for durable goods decrease 1.0% after increasing 5.0% in January. Durable goods orders have declined two of the last three months with the January decrease. Excluding transportation, new orders were virtually unchanged. Excluding defense, new orders decreased 0.5%. Transportation equipment, also down three of the last four months, drove the decrease, falling 2.8%.
- Imports and exports: February saw import prices edge down 0.1%, following a 0.4% decline in January. Import prices have not advanced since June 2022, with the exception of a 0.1% increase in December. Prices for U.S. imports declined 1.1% over the past year, the first 12-month decrease since December 2020, and the largest year-over-year drop since September 2020. Import fuel prices decreased 4.9% in February for the second consecutive month. Those are the largest monthly drops since September 2022, and import fuel prices have not risen on a one-month basis since June 2022. Nonfuel import prices climbed 0.4% in February after advancing 0.2% in January. Nonfuel import prices advanced 0.2% from February 2022. Export prices rose 0.2% in February, after rising 0.5% in January. Those are the first monthly increases in export prices since June 2022. Despite the advance, exports declined 0.8% over the past 12 months, the first year-over-year decrease since the period ended November 2020.
- Trade activity weakened in February. The international trade in goods deficit was $91.6 billion in February, up $0.5 billion, or 0.6%, from January. Exports of goods for February were $167.8 billion, $6.7 billion, or 3.8%, less than January exports. Imports of goods were $259.5 billion in February, $6.2 billion, or 2.3%, below December. The February decrease in exports reflected declines in most major categories, with autos falling 11.9% and consumer goods down 4.6%. In February, auto imports were down 7.1%, while imports of consumer goods contracted 5.6%.
- The latest information on international trade in goods and services, released March 8, is for January and shows that the goods and services trade deficit was $68.3 billion, an increase of 1.6% from the December deficit. January exports were $257.5 billion, 3.4% higher than December exports. January imports were $325.8 billion, 3.0% more than December imports. For the 12 months ended in January, the goods and services deficit decreased 21.9%. Exports increased 13.3%, while imports increased 3.5%.
- International markets: The battle against rising inflation remained at the forefront for most of the world's economies. Core inflation (excluding food and energy prices) hit a record high in the eurozone for March. The European Central Bank hiked interest rates 50.0 basis points and will likely call for a similar rate increase in May. The Bank of England added 25.0 basis points to its target interest rate after inflation in February (10.4% annual increase) exceeded the bank's expectations. On the other hand, inflation in Canada eased in February, falling 0.7 percentage point to an annual rate of 5.2%. Likewise, Japan's Consumer Price Index fell a full percentage point to 3.3% in February, bolstered by government subsidies for electricity and natural gas. However, food prices continued to rise. For March, the STOXX Europe 600 Index lost 1.4%; the United Kingdom's FTSE dropped 3.9%; Japan's Nikkei 225 Index gained 0.4%; and China's Shanghai Composite Index fell 1.7%.
- Consumer confidence: The Conference Board Consumer Confidence Index® increased in March to 104.2, up from 103.4 in February. The Present Situation Index, based on consumers' assessment of current business and labor market conditions, decreased to 151.1 in March, down from 153.0 in the previous month. The Expectations Index — based on consumers' short-term outlook for income, business, and labor market conditions — ticked up to 73.0 in March from 70.4 in February. According to the Conference Board's report, an Expectations Index reading below 80.0 could signal a recession within the next year. It has been below this level for 12 of the past 13 months.
Eye on the Quarter Ahead
The second quarter is likely to see interest rates continue to be pushed higher by the Federal Reserve. However, rate hikes may be smaller, with the possibility of a reduction in the number of increases. The labor sector should remain solid, although job gains may wane some. Industrial production may actually show some gains, while the services sector is more likely to strengthen.
Data sources: Economic: Based on data from U.S. Bureau of Labor Statistics (unemployment, inflation); U.S. Department of Commerce (GDP, corporate profits, retail sales, housing); S&P/Case-Shiller 20-City Composite Index (home prices); Institute for Supply Management (manufacturing/services). Performance: Based on data reported in WSJ Market Data Center (indexes); U.S. Treasury (Treasury yields); U.S. Energy Information Administration/Bloomberg.com Market Data (oil spot price, WTI Cushing, OK); www.goldprice.org (spot gold/silver); Oanda/FX Street (currency exchange rates). News items are based on reports from multiple commonly available international news sources (i.e., wire services) and are independently verified when necessary with secondary sources such as government agencies, corporate press releases, or trade organizations. All information is based on sources deemed reliable, but no warranty or guarantee is made as to its accuracy or completeness. Neither the information nor any opinion expressed herein constitutes a solicitation for the purchase or sale of any securities, and should not be relied on as financial advice. Forecasts are based on current conditions, subject to change, and may not come to pass. U.S. Treasury securities are guaranteed by the federal government as to the timely payment of principal and interest. The principal value of Treasury securities and other bonds fluctuates with market conditions. Bonds are subject to inflation, interest-rate, and credit risks. As interest rates rise, bond prices typically fall. A bond sold or redeemed prior to maturity may be subject to loss. Past performance is no guarantee of future results. All investing involves risk, including the potential loss of principal, and there can be no guarantee that any investing strategy will be successful.
The Dow Jones Industrial Average (DJIA) is a price-weighted index composed of 30 widely traded blue-chip U.S. common stocks. The S&P 500 is a market-cap weighted index composed of the common stocks of 500 largest, publicly traded companies in leading industries of the U.S. economy. The NASDAQ Composite Index is a market-value weighted index of all common stocks listed on the NASDAQ stock exchange. The Russell 2000 is a market-cap weighted index composed of 2,000 U.S. small-cap common stocks. The Global Dow is an equally weighted index of 150 widely traded blue-chip common stocks worldwide. The U.S. Dollar Index is a geometrically weighted index of the value of the U.S. dollar relative to six foreign currencies. Market indexes listed are unmanaged and are not available for direct investment.
IMPORTANT DISCLOSURES
Philippe E Berthoud and William E. Riquier offer Securities and Advisory Services through United Planners Financial Services, Member FINRA/SIPC. United Planners and The Retirement Financial Center are independent companies.
Broadridge Investor Communication Solutions, Inc. does not provide investment, tax, legal, or retirement advice or recommendations. The information presented here is not specific to any individual's personal circumstances. To the extent that this material concerns tax matters, it is not intended or written to be used, and cannot be used, by a taxpayer for the purpose of avoiding penalties that may be imposed by law. Each taxpayer should seek independent advice from a tax professional based on his or her individual circumstances. These materials are provided for general information and educational purposes based upon publicly available information from sources believed to be reliable — we cannot assure the accuracy or completeness of these materials. The information in these materials may change at any time and without notice.