
Quarterly Market Review: April-May 2022
The Markets (second quarter through June 30, 2022)
For the first time since 2015, each of the benchmark indexes lost value for two consecutive quarters. They also posted losses for June, marking three consecutive down months for the tech-heavy Nasdaq, its longest losing streak since 2015. Investors watched for signs of an economic deceleration in the U.S., with inflation continuing to run at multi-decade highs, and monetary policymakers maintaining a firm stance that their priority remains bringing down prices even if it means slowing economic growth. Nevertheless, Wall Street has suffered one of its worst six-month stretches in decades. The S&P 500 is poised for its worst first half since 1962. Ten-year Treasury yields climbed from 2.37% at the beginning of the quarter to over 3.00%. The dollar is on pace for its best quarter since 2016. Consumer spending slowed for the first time this year, possibly indicating that the economy is indeed weakening. Consumer sentiment fell to its lowest level since 2021. Crude oil prices rose marginally in the quarter, spiking at $123.18 per barrel in early June, ultimately settling at around $105.00 by the end of the quarter. Gold prices declined each month of the quarter as investors weighed rising interest rates against fears of a recession. According to AAA, as of June 30, the average price for regular gasoline was $4.857 per gallon, $0.90 less than the previous week but $1.80 per gallon more than than a year ago. As prices for crude oil and gasoline increased, demand waned, helping to pull prices lower. In addition, OPEC+ agreed to increase output in July and August to compensate for the drop in production due to the sanctions placed on Russia.
Equities fell sharply in April as some disappointing earnings data from several mega-cap companies added to investor worries about rising inflation, the war in Ukraine, and the possibility of an economic pullback. The Nasdaq dropped the most since October 2008, falling nearly 24.0% from its peak as it entered bear territory. The S&P 500 notched its worst month since the beginning of the pandemic, dragged lower by heavy losses in communication services, consumer discretionary, and information technology. Bond prices also lagged as yields increased in anticipation of rising interest rates as part of the Federal Reserve's plan to quell inflation. While consumers worried about cost containment and its impact on the economy, one factor helping to drive inflation higher was strong wage growth propelled by a tight labor market. Weekly jobless claims fell to their lowest level since 1970, while the unemployment rate dropped to a pre-pandemic 3.6%. Entering May, Americans remained focused on rising inflation, the ongoing war in Ukraine, lockdowns in China due to rising COVID numbers, and the impact of the Fed's program of fiscal tightening.
May proved to be a month of market swings. Equities lost value for the first three weeks of the month. However, a late rally helped the benchmark indexes close the month relatively flat, with the exception being the tech-heavy Nasdaq, which followed April's sharp declines by falling another 2.0%. Early in the month the Federal Reserve raised interest rates 50 basis points and announced plans to start reducing its balance sheet in June. The Fed's hawkish pronouncements in its effort to curb rising inflation spurred worries of a recession, despite solid economic data from the prior month.
Stocks soured in June as a slowdown in consumer spending (personal consumption expenditures), which accounts for nearly 70% of economic activity, prompted concerns about a recession. The Federal Reserve increased the target range for the federal funds rate 75 basis points, more than expected, as forecasters estimated a 50-basis point rate increase. Despite a surge mid-month, each of the benchmark indexes ended June in the red. Crude oil prices fell in June, the first monthly decrease since November. The dollar advanced, while gold prices slid lower.
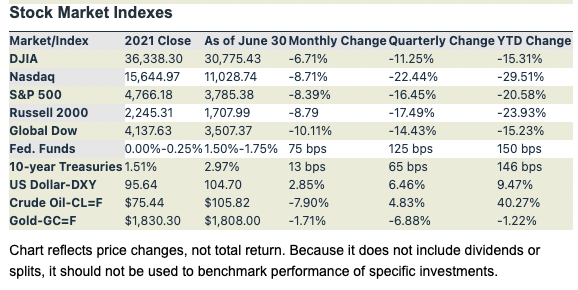
Chart reflects price changes, not total return. Because it does not include dividends or splits, it should not be used to benchmark performance of specific investments.
Latest Economic Reports
- Employment: Employment rose by 390,000 in May. Notable job gains occurred in leisure and hospitality, in professional and business services, and in transportation and warehousing. Despite the increase, employment is down by 822,000, or 0.5%, from its pre-pandemic level in February 2020. The unemployment rate remained at 3.6% for the third month in a row. The number of unemployed persons was essentially the same at 6.0 million. By comparison, in February 2020 prior to the coronavirus (COVID-19) pandemic, the unemployment rate was 3.5%, and the number of unemployed persons was 5.7 million. Among the unemployed, the number of workers who permanently lost their jobs was unchanged at 1.4 million in May. The number of persons who were unable to work because their employer closed or lost business due to the pandemic fell to 1.8 million. The labor force participation rate increased 0.3 percentage point to 62.3% in May. The employment-population ratio increased by 0.3 percentage point to 60.2%. In May, average hourly earnings rose by $0.10 to $31.95. Over the last 12 months ended in May, average hourly earnings increased by 5.2%. The average work week was 34.6 hours in May, unchanged for the third consecutive month.
- There were 231,000 initial claims for unemployment insurance for the week ended June 25, while the total number of insured unemployment claims was 1,328,000 as of June 18. During the second quarter of the year, claims for unemployment fell to their lowest levels since 1970. A year ago, there were 3,266,000 insured unemployment claims.
- FOMC/interest rates: Following its meeting in June, the Federal Open Market Committee increased the federal funds target rate range by 75 basis points to 1.50%-1.75%. In support of its decision, the Committee noted that it is "highly attentive to inflation risks" and that it "is strongly committed to returning inflation to its 2.0% objective."
- GDP/budget:Gross domestic product decreased 1.6% in the first quarter of 2022. GDP advanced 6.9% in the fourth quarter of 2021. A record surge in the trade deficit was largely responsible for the decline in first-quarter GDP. Also, consumer spending, as measured by personal consumption expenditures, rose 1.8%, down from 2.5% in the fourth quarter of 2021. Consumers cut spending on goods such as clothes, home furnishings, and food. Fixed investment advanced 7.4%, driven higher by a 10.0% increase in nonresidential (business) fixed investment. Exports dropped 4.8%, while imports, a negative in the calculation of GDP, increased 18.9%. Also dragging GDP lower was a 6.8% decrease in federal government spending, while state and local government spending dipped 0.5%. The personal consumption expenditures (PCE) price index, a measure of inflation, increased 7.1%. Excluding food and energy prices, the PCE price index increased 5.2%.
- The Treasury budget deficit came in at $66.2 billion in May, 50.0% smaller than the $132.0 billion shortfall in May 2021. Through the first eight months of fiscal year 2022, the deficit sits at $426.2 billion, 79.0% lower than the deficit over the same period in fiscal year 2021 as outlays dropped 19.0%, while receipts increased 29.0%. So far in this fiscal year, individual income tax receipts have risen 46.0% and corporate income tax receipts have increased 17.0%.
- Inflation/consumer spending: According to the latest Personal Income and Outlays report for May, both personal income and disposable personal income rose 0.5%, the same increase as in the previous month. Consumer spending increased 0.2% following a 0.6% jump in April. Consumer prices climbed 0.6% in May after advancing 0.2% in April. Consumer prices have risen 6.3% since May 2021.
-
The Consumer Price Index climbed 1.0% in May after climbing 0.3% in the previous month. The May increase was broad-based, with advances in prices for shelter, gasoline, and food being the largest contributors. The gasoline index rose 4.1% in May, prices for food rose 1.0%, and the index for shelter increased 0.6%. The CPI increased 8.6% for the 12 months ended in May, the largest 12-month increase since the period ending December 1981.
-
Prices that producers receive for goods and services jumped 0.8% in May following a 0.4% increase in April. Producer prices have increased 10.8% since May 2021. Prices less foods, energy, and trade services increased 0.5% in May and 6.8% since May 2021. In May, nearly two-thirds of the rise in the PPI was due to a 1.4% advance in prices for final demand goods. Prices for final demand services increased 0.4%. A major factor in the May increase in the prices for goods was a 5.0% increase in energy prices, within which gasoline prices spiked 8.4%.
- Housing: Sales of existing homes retreated for the fourth consecutive month in May, falling 3.4% from the April estimate. Year over year, existing home sales were 8.6% under the May 2021 total. According to the latest survey from the National Association of Realtors®, home sales have essentially returned to the levels seen in 2019, prior to the pandemic, after two years of exceptional performance. The median existing-home price was $407,600 in May, up from $395,500 in April and 14.8% more than May 2021 ($355,000). Unsold inventory of existing homes represents a 2.6-month supply at the current sales pace. Sales of existing single-family homes also fell, down 3.6% in May. Sales of existing single-family homes have fallen 7.7% since May 2021. The median existing single-family home price was $414,200 in May, up from $401,700 in April and up 14.6% from May 2021 ($361,300).
- Sales of new single-family homes rose 10.7% in May, the first advance in the last five months. The median sales price of new single-family houses sold in May was $449,000 ($454,700 in April). The May average sales price was $511,400 ($569,500 in April). The inventory of new single-family homes for sale in May represented a supply of 7.0 months at the current sales pace, down from April's 7.6-month supply. Sales of new single-family homes in May were 5.9% below the May 2021 estimate.
- Manufacturing: Industrial production increased 0.2% in May following a 1.4% increase in April. In May, manufacturing output declined 0.1% after three months when growth averaged nearly 1.0%. The indexes for utilities and mining rose 1.0% and 1.3%, respectively, in May. Total industrial production was 5.8% higher than it was a year earlier. Since May 2021, manufacturing has risen 4.8%, mining has jumped 9.0%, while utilities increased 8.4%.
- May saw new orders for durable goods increase $1.9 billion, or 0.7%, marking the seventh monthly increase out of the last eight months. Excluding transportation, new orders rose 0.7% in May. Excluding defense, new orders increased 0.6%. Transportation equipment, up two consecutive months, led the increase, up $0.7 billion, or 0.8%.
- Imports and exports: Import prices rose 0.6% in May after advancing 0.4% in April, according to the U.S. Bureau of Labor Statistics. Higher fuel prices offset lower nonfuel prices to account for the overall May increase. Fuel import prices rose 7.5% in May, with higher petroleum and natural gas prices both contributing to the increase. The price index for import fuel rose 73.5% over the past year, the largest 12-month advance since increasing 87.0% in November 2021. Prices for nonfuel imports declined 0.3% in May, the first monthly decrease since November 2020. Prices for U.S. exports advanced 2.8% in May following a 0.8% rise the previous month. Higher prices for both nonagricultural and agricultural exports contributed to the export price rise in May. Export prices have risen 18.9% since May 2021, the largest year-over-year rise since September 1984.
- The international trade in goods deficit was $104.3 billion in May, down $2.4 billion, or 2.2%, from April. Exports of goods were $176.6 billion in May, $2.0 billion more than in April. Imports of goods were $280.9 billion, $0.4 billion less than April imports.
- The latest information on international trade in goods and services, released June 7, is for April and shows that the goods and services trade deficit declined by $20.6 billion to $87.1 billion from the March deficit. April exports were $252.6 billion, $8.5 billion more than March exports. April imports were $339.7 billion, $12.1 billion less than March imports. Year over year, the goods and services deficit increased $107.9 billion, or 41.1%, from the same period in 2021. Exports increased $151.3 billion, or 18.8%. Imports increased $259.2 billion, or 24.3%.
- International markets: The United States is not the only country seeing rising costs. Several European nations, plus Israel and South Korea, have seen surges in inflation since the start of the pandemic. Germany, France, Spain, and Italy have seen inflation spike recently. South Korea's inflation reached a 13-year high in April, while Israel, which had maintained low inflation rates through 2021, saw inflation jump 25.0% from the first quarter of 2020 to the beginning of 2022. Inflation rates in the United Kingdom hit a 40-year high in May, up 9.1%. Several countries have taken various measures to try to curb inflationary pressures, from freezing the price of gas and electricity ("tariff shield"), to transfers to the most vulnerable (e.g., energy vouchers), temporary tax reductions or discounts on fuel prices, and price regulation. Of course, several countries have also tightened monetary policy by raising interest rates. Overall, for the markets in June, the STOXX Europe 600 Index declined 5.7%. The United Kingdom's FTSE slid 2.7%. Japan's Nikkei 225 Index fell 2.4%, while China's Shanghai Composite Index rose 5.6%.
- Consumer confidence: The Conference Board Consumer Confidence Index® decreased in June following a decline in May. The index stands at 98.7, down from 103.2 in May. The overall index is at its lowest level since February 2021. The Present Situation Index, based on consumers' assessment of current business and labor market conditions, declined to 147.1 in June, down marginally from 147.4 in May. The Expectations Index, based on consumers' short-term outlook for income, business, and labor market conditions, declined to 66.4 in June (73.7 in May), its lowest level since March 2013.
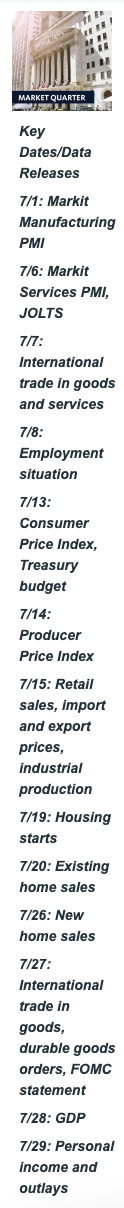
Eye on the Month Ahead
Inflation continued to run hot in June, prompting a plan of fiscal tightening from the Federal Reserve, which included a 75-basis point interest rate increase. The Fed meets again in July and is certain to increase interest rates by at least 50 basis points, with the growing likelihood of another 75-basis point jump, particularly since the Fed does not meet again until September. The first estimate of second-quarter gross domestic product is also out in July. The economy retracted 1.5% in the first quarter.
Data sources: Economic: Based on data from U.S. Bureau of Labor Statistics (unemployment, inflation); U.S. Department of Commerce (GDP, corporate profits, retail sales, housing); S&P/Case-Shiller 20-City Composite Index (home prices); Institute for Supply Management (manufacturing/services). Performance: Based on data reported in WSJ Market Data Center (indexes); U.S. Treasury (Treasury yields); U.S. Energy Information Administration/Bloomberg.com Market Data (oil spot price, WTI Cushing, OK); www.goldprice.org (spot gold/silver); Oanda/FX Street (currency exchange rates). News items are based on reports from multiple commonly available international news sources (i.e., wire services) and are independently verified when necessary with secondary sources such as government agencies, corporate press releases, or trade organizations. All information is based on sources deemed reliable, but no warranty or guarantee is made as to its accuracy or completeness. Neither the information nor any opinion expressed herein constitutes a solicitation for the purchase or sale of any securities, and should not be relied on as financial advice. Forecasts are based on current conditions, subject to change, and may not come to pass. U.S. Treasury securities are guaranteed by the federal government as to the timely payment of principal and interest. The principal value of Treasury securities and other bonds fluctuates with market conditions. Bonds are subject to inflation, interest-rate, and credit risks. As interest rates rise, bond prices typically fall. A bond sold or redeemed prior to maturity may be subject to loss. Past performance is no guarantee of future results. All investing involves risk, including the potential loss of principal, and there can be no guarantee that any investing strategy will be successful.
The Dow Jones Industrial Average (DJIA) is a price-weighted index composed of 30 widely traded blue-chip U.S. common stocks. The S&P 500 is a market-cap weighted index composed of the common stocks of 500 largest, publicly traded companies in leading industries of the U.S. economy. The NASDAQ Composite Index is a market-value weighted index of all common stocks listed on the NASDAQ stock exchange. The Russell 2000 is a market-cap weighted index composed of 2,000 U.S. small-cap common stocks. The Global Dow is an equally weighted index of 150 widely traded blue-chip common stocks worldwide. The U.S. Dollar Index is a geometrically weighted index of the value of the U.S. dollar relative to six foreign currencies. Market indexes listed are unmanaged and are not available for direct investment.
IMPORTANT DISCLOSURES
Philippe E Berthoud and William E. Riquier offer Securities and Advisory Services through United Planners Financial Services, Member FINRA/SIPC. United Planners and The Retirement Financial Center are independent companies.
Broadridge Investor Communication Solutions, Inc. does not provide investment, tax, legal, or retirement advice or recommendations. The information presented here is not specific to any individual's personal circumstances. To the extent that this material concerns tax matters, it is not intended or written to be used, and cannot be used, by a taxpayer for the purpose of avoiding penalties that may be imposed by law. Each taxpayer should seek independent advice from a tax professional based on his or her individual circumstances. These materials are provided for general information and educational purposes based upon publicly available information from sources believed to be reliable — we cannot assure the accuracy or completeness of these materials. The information in these materials may change at any time and without notice.
This communication is strictly intended for individuals residing in the state(s) of AZ, CA, CO, CT, FL, GA, ME, MD, MA, MT, NV, NH, NJ, NY, VA and WA. No offers may be made or accepted from any resident outside the specific states referenced.