
Market Month: August 2022
The Markets (as of market close August 31, 2022)
Through the first half of August, the stock market continued to ride July's rally. Including the first two weeks of August, stocks had posted four consecutive weekly gains — the longest weekly rally of 2022. The latest inflation data showed prices had fallen in July, bolstering investor confidence that the Fed may begin to reel in its aggressive interest-rate hike policy. By mid-August, the S&P 500 had recouped half of its losses from the beginning of the year, and the Nasdaq had risen over 20.0% from its low in June. U.S. corporate profits rose 9.1% to a fresh record high of $2.62 trillion in the second quarter of 2022, following a 4.9% drop in the previous period. It appeared that even if the Fed continued its hawkish push to get inflation down to the 2.0% target, the economy had thus far been resilient, with the labor market continuing to show strength, while industrial production advanced.
Despite these developments, Federal Reserve officials maintained their hawkish rhetoric. Then the stock rally of the summer of 2022 came to an abrupt end. First, the release of the minutes of the July meeting of the Federal Open Market Committee, revealing that several Committee members were concerned that inflation remained unacceptably high, and that, despite declines in oil and some commodities, there was little evidence to date that inflation pressures were subsiding. Then Fed Chair Jerome Powell spoke before the Jackson Hole Economic Symposium and reiterated the Fed's resolve to stamp down inflation, even if that means slower economic growth and "some pain on households." Investors reacted by pulling from equities, sending stock values lower, while giving back gains enjoyed earlier in the month. Each of the benchmark indexes ended August in the red, led by the tech-heavy Nasdaq, followed by the S&P 500 and the Dow.
Bond prices also fell in August, pushing yields higher. Ten-year Treasury yields rose nearly 50 basis points in August. Two-year Treasury yields were about 33 basis points higher, resulting in an inverted yield curve, which may be an indicator of a recession. The dollar rose higher against a basket of world currencies. Gold, like most other commodities, slid lower in August.
Crude oil prices declined for the third consecutive month in August, as rising inflation has cut into consumer spending, weakening demand. Gas prices also continued to fall in August after reaching record highs in May and June. The national average retail price for regular gasoline was $3.827 per gallon on August 29, down from $4.330 on July 25 but $0.688 higher than a year ago.
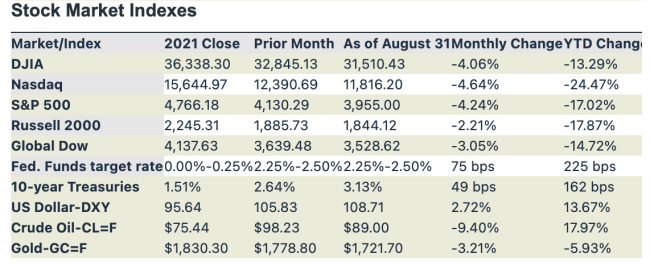
Chart reflects price changes, not total return. Because it does not include dividends or splits, it should not be used to benchmark the performance of specific investments.
Latest Economic Reports
-
Employment: Employment rose by 528,000 in July, well above the revised June total of 398,000 and exceeding the prior four-month average (388,000). Job growth was widespread in July, led by gains in professional and business services, leisure and hospitality, and health care. With the July increase, employment has increased by 22.0 million since reaching a low in April 2020 and has returned to its pre-pandemic level of February 2020. The unemployment rate edged down to 3.5% in July, and the number of unemployed persons dipped marginally to 5.7 million, with both measures returning to their pre-pandemic levels. Among the unemployed, the number of workers who permanently lost their jobs was 1.2 million in July (1.3 million in June). In July, the number of persons who were unable to work because their employer closed or lost business due to the pandemic rose to 2.2 million, up from 2.1 million in June. The labor force participation rate was little changed at 62.1% in July. The employment-population ratio, at 60.0%, was also little changed from the previous month. Both measures remain below their February 2020 values (63.4% and 61.2%, respectively). In July, average hourly earnings rose by $0.15 to $32.27. Over the 12 months ended in July, average hourly earnings increased by 5.2%. The average work week was 34.6 hours in July, unchanged for the fiftieth month in a row.

- There were 243,000 initial claims for unemployment insurance for the week ended August 20 (256,000 on July 23), while the total number of insured unemployment claims was 1,415,000 as of August 13 (1,359,000 on July 16). A year ago, there were 395,000 initial claims for unemployment insurance and 2,804,000 total insured unemployment claims.
- FOMC/interest rates: The Federal Open Market Committee did not meet in August and does not meet again until mid-September. Nevertheless, much of the rhetoric from Federal Reserve officials points to another interest-rate hike of at least 75 basis points.
- GDP/budget:The economy has decelerated for two quarters in a row. Gross domestic product decreased 0.6% in the second quarter of 2022 after falling 1.6% in the first quarter. A portion of the second-quarter downturn is attributable to sectors impacted by higher interest rates that are cutting into demand (e.g., housing, nonresidential fixed investment), while rising inflation and ongoing supply-chain disruptions are impacting production. Consumer spending rose 1.5% in the second quarter after increasing 1.8% in the first quarter. Most of the increase in consumer spending is attributable to a 3.6% jump in services, while spending on durables slid 0.1%. Also dragging down GDP was a 4.5% decline in fixed investment, within which residential fixed investment dropped 16.2%, evidence of the slowdown in the housing sector. Nonresidential (business) fixed investment was unchanged in the second quarter after rising 10.0% in the previous quarter. Exports rose 17.6% in the second quarter, while imports, which are a negative in the calculation of GDP, advanced 2.8% after jumping 18.9% in the first quarter. In the second quarter, the personal consumption expenditures price index, a measure of inflation, increased 7.1%, the same increase as in the first quarter.
- The Treasury budget deficit came in at $211.1 billion in July, up from $88.8 billion in June but down from the deficit of $302.1 billion in July 2021. Through the first 10 months of fiscal year 2022, the deficit sits at $726.1 billion, $1,813.9 billion lower than the deficit over the same period in fiscal year 2021, as outlays dropped $1,027.2 billion while receipts increased $786.6 billion. So far in this fiscal year, individual income tax receipts have risen 32.7%, and corporate income tax receipts have increased 11.4%.
- Inflation/consumer spending: Overall, inflationary pressures weakened in July. According to the latest Personal Income and Outlays report, the personal consumption expenditures price index, a measure of inflation favored by the Federal Reserve, fell 0.1% in July after increasing 1.0% the previous month. Consumer prices have risen 6.3% since July 2021, down from the 12-month spread for the period ended in June 2021 (6.8%). Personal income and disposable personal income increased 0.2% in July after increasing 0.7% in June. Consumer spending inched up 0.1% in July, following a 1.0% increase in June.
-
The Consumer Price Index was unchanged in July after climbing 1.3% in the previous month. For the 12 months ended in July, the CPI increased 8.5% (9.1% for the 12-month period ended in June). Both the monthly and 12-month rates were below expectations. In July, the CPI less food and energy rose 0.3% after increasing 0.7% in June. Pulling the CPI lower in July was a 7.7% drop in gasoline prices, offsetting a 1.1% increase in prices for food and a 0.5% rise in prices for shelter. Nevertheless, for the 12 months ended in July, food prices are up 10.9%, the largest increase since May 1979. And despite the decline in July, gasoline prices have risen 44.0% over the last 12 months.
-
Prices that producers receive for goods and services dipped 0.5% in July, following increases of 1.0% in June and 0.8% in May. Producer prices have increased 9.8% since July 2021 (11.3% for the 12 months ended in June). Prices less foods, energy, and trade services increased 0.2% in July and 5.8% since July 2021. In July, the decrease in the producer price index was attributable to a 1.8% decline in prices for goods, the largest decline since April 2020. In contrast, prices for services advanced 0.1%. In July, 80.0% of the drop in prices for goods was attributable to a 16.7% decrease in gasoline prices. Food prices, on the other hand, rose 1.0% in July after falling 0.2% in June.
- Housing: Sales of existing homes retreated for the sixth consecutive month in July, falling 5.9% from the June estimate. Year over year, existing home sales were 20.2% under the July 2021 total. According to the latest survey from the National Association of Realtors®, mortgage rates have risen sharply over a short span of time, impacting potential home buyers. The median existing-home price was $403,800 in July, down from $413,800 in June but 10.8% higher than July 2021 ($364,600). Unsold inventory of existing homes represents a 3.3-month supply at the current sales pace, up from a 2.9-month supply in June. Sales of existing single-family homes also fell, down 5.5% in July. Sales of existing single-family homes have fallen 19.0% since June 2021. The median existing single-family home price was $410,600 in July, down from $420,900 in June but 130.6% over the July 2021 price.
- Sales of new single-family homes also declined in July, falling 12.6% from June's total and 29.6% from July 2021. The median sales price of new single-family houses sold in July was $439,400 ($414,900 in June). The July average sales price was $546,800 ($457,300 in June). The inventory of new single-family homes for sale in July represent a supply of 10.9 months at the current sales pace, up from June's 9.2-month supply.
- Manufacturing: Industrial production increased 0.6% in July. Industrial production was flat in June. In July, manufacturing output gained 0.7% after falling 0.4% in each of the previous two months. The production of motor vehicles and parts rose 6.6% in July, while factory output elsewhere moved up 0.3%. In July, the index for mining rose 0.7%, while the index for utilities fell 0.8%. Overall, total industrial production in July was 3.9% higher than it was a year earlier. Since July 2021, manufacturing has risen 3.2%, mining has jumped 7.9%, while utilities have increased 2.2%.
- July saw new orders for durable goods increase less than $0.1 billion, virtually unchanged from the June total. Excluding transportation, new orders rose 0.3% in July. Excluding defense, new orders increased 1.2%. Transportation equipment, up for three consecutive months, decreased in July, falling 0.7% from the previous month.
- Imports and exports: Import prices declined 1.4% in July for the first time since December 2021, according to the U.S. Bureau of Labor Statistics. Prices rose 0.3% in June. The July decrease in import prices was the largest monthly decline since April 2020. Import prices rose 8.8% over the past 12 months, the smallest year-over-year increase since the 12-month period ended in March 2021. In July, lower fuel and nonfuel prices contributed to the monthly decrease. Fuel import prices fell 7.5% in July, following a 6.2% increase the previous month. Despite the July decline, import fuel prices advanced 56.6% over the past year. Prices for nonfuel imports declined for the third consecutive month, dipping 0.5% in July. Prices for U.S. exports fell 3.3% in July following a 0.7% rise the previous month. The July decline in export prices was the largest monthly decrease since April 2020. Lower agricultural and nonagricultural prices contributed to the July decline. Prices for exports have risen 13.1% since July 2021, the lowest annual advance since the 12-month period ended in March 2021.
- The international trade in goods deficit was $89.1 billion in July, down $9.5 billion, or 9.7%, from June. Exports of goods were $181.0 billion in July, $0.4 billion less than in June. Imports of goods were $270.0 billion in July, $9.9 billion less than June imports.
- The latest information on international trade in goods and services, released August 4, is for June and shows that the goods and services trade deficit declined by $5.3 billion, or 6.2%, to $79.6 billion from the May deficit. June exports were $260.8 billion, $4.2 billion more than May exports. June imports were $340.4 billion, $1.0 billion lower than May imports. Year over year, the goods and services deficit increased $134.1 billion, or 33.4%, from the same period in 2021. Exports increased $246.2 billion, or 20.0%. Imports increased $380.3 billion, or 23.3%.
- International markets: Inflationary pressures continued to be felt around the world. Consumer prices rose 9.1% in the eurozone from a year earlier, increasing the likelihood that the European Central Bank will respond by aggressively raising interest rates. Vaulting inflation underscored the continued impact of the Russia-Ukraine war on Europe. In its latest move, Russia shut down its main artery for natural gas to Europe for maintenance, prompting European nations to scramble to fill gas storage facilities to prevent a shortage in the winter. Elsewhere, China's factory activity remained in contraction in August, resulting in U.S. business confidence in China falling. Overall for the markets in August, the STOXX Europe 600 Index slid 4.5%. The United Kingdom's FTSE fell nearly 2.0%. Japan's Nikkei 225 Index rose 1.25%, while China's Shanghai Composite Index advanced 1.2%.
- Consumer confidence: The Conference Board Consumer Confidence Index® increased in August for the first time in the last four months. The August index stands at 103.2, up from 95.3 in July. The Present Situation Index, based on consumers' assessment of current business and labor market conditions, improved to 145.4 in August, up from 139.7 in July. The Expectations Index, based on consumers' short-term outlook for income, business, and labor market conditions, rose to 75.1 in August (65.6 in July).
Eye on the Month Ahead
The Federal Open Market Committee meeting in the middle of September is expected to culminate in an interest-rate hike of at least 75 basis points. Investors remain concerned that the Fed's actions taken to try to slow inflation will also push the economy into a recession. Some economic sectors are showing signs of slowing down, particularly housing and retail sales, while gross domestic product retracted in the second quarter. As the third quarter of the year comes to a close, September may prove to be a month of more noticeable economic waning.
Data sources: Economic: Based on data from U.S. Bureau of Labor Statistics (unemployment, inflation); U.S. Department of Commerce (GDP, corporate profits, retail sales, housing); S&P/Case-Shiller 20-City Composite Index (home prices); Institute for Supply Management (manufacturing/services). Performance: Based on data reported in WSJ Market Data Center (indexes); U.S. Treasury (Treasury yields); U.S. Energy Information Administration/Bloomberg.com Market Data (oil spot price, WTI, Cushing, OK); www.goldprice.org (spot gold/silver); Oanda/FX Street (currency exchange rates). News items are based on reports from multiple commonly available international news sources (i.e., wire services) and are independently verified when necessary with secondary sources such as government agencies, corporate press releases, or trade organizations. All information is based on sources deemed reliable, but no warranty or guarantee is made as to its accuracy or completeness. Neither the information nor any opinion expressed herein constitutes a solicitation for the purchase or sale of any securities, and should not be relied on as financial advice. Forecasts are based on current conditions, subject to change, and may not come to pass. U.S. Treasury securities are guaranteed by the federal government as to the timely payment of principal and interest. The principal value of Treasury securities and other bonds fluctuates with market conditions. Bonds are subject to inflation, interest-rate, and credit risks. As interest rates rise, bond prices typically fall. A bond sold or redeemed prior to maturity may be subject to loss. Past performance is no guarantee of future results. All investing involves risk, including the potential loss of principal, and there can be no guarantee that any investing strategy will be successful.
The Dow Jones Industrial Average (DJIA) is a price-weighted index composed of 30 widely traded blue-chip U.S. common stocks. The S&P 500 is a market-cap weighted index composed of the common stocks of 500 largest, publicly traded companies in leading industries of the U.S. economy. The NASDAQ Composite Index is a market-value weighted index of all common stocks listed on the NASDAQ stock exchange. The Russell 2000 is a market-cap weighted index composed of 2,000 U.S. small-cap common stocks. The Global Dow is an equally weighted index of 150 widely traded blue-chip common stocks worldwide. The U.S. Dollar Index is a geometrically weighted index of the value of the U.S. dollar relative to six foreign currencies. Market indexes listed are unmanaged and are not available for direct investment.
IMPORTANT DISCLOSURES
Philippe E Berthoud and William E. Riquier offer Securities and Advisory Services through United Planners Financial Services, Member FINRA/SIPC. United Planners and The Retirement Financial Center are independent companies.
Broadridge Investor Communication Solutions, Inc. does not provide investment, tax, legal, or retirement advice or recommendations. The information presented here is not specific to any individual's personal circumstances. To the extent that this material concerns tax matters, it is not intended or written to be used, and cannot be used, by a taxpayer for the purpose of avoiding penalties that may be imposed by law. Each taxpayer should seek independent advice from a tax professional based on his or her individual circumstances. These materials are provided for general information and educational purposes based upon publicly available information from sources believed to be reliable — we cannot assure the accuracy or completeness of these materials. The information in these materials may change at any time and without notice.
This communication is strictly intended for individuals residing in the state(s) of AZ, CA, CO, CT, FL, GA, ME, MD, MA, MT, NV, NH, NJ, NY, VA and WA. No offers may be made or accepted from any resident outside the specific states referenced.
Prepared by Broadridge Advisor Solutions Copyright 2022.